
What is Throughput Accounting? Throughput Accounting Definition
Throughput Accounting is the Theory of Constraints method of accounting which does NOT allocate costs but instead places emphasis on increasing Throughput.
Throughput Accounting reflects the operating realities in which companies operate but is simple, yet highly effective. It creates alignment and agreement on decisions, between all levels of an organization. Greater clarity for making decisions in businesses can be rapidly achieved by the use of Throughput Accounting. Additionally, it requires very little to implement in terms of cost and/or effort, yet offers significant improvements over more traditional, complex, and expensive alternatives. Throughput Accounting can be utilized by a company, no matter where it is at in its life cycle, whether a newly-founded startup or a publicly traded company in existence for many years. Its effectiveness is not size or resource-dependent.
Throughput Accounting offers a vastly different take on accounting than traditional forms of accounting such as standard costing, job shop costing, or activity-based costing. I would say it is an improved version of accounting, but that would be to say Throughput Accounting was built on the foundation laid by previous accounting systems. Nothing could be further from the truth. Throughput Accounting is grounded in reality and was built from the ground up as a new form of accounting to achieve the aims other accounting systems attempt, but fail to accomplish.
Unique to Throughput Accounting alone is its ability to cause managers to view decisions with complete clarity and alignment from a financial perspective. With other forms of accounting, decisions are difficult to make, with each manager having his or her thoughts on the results of the decision. With Throughput Accounting, clarity is finally achieved and consensus from a financial perspective can be quickly reached.
Throughput Accounting is the only accounting system that properly prioritizes the three main aspects of a business: Throughput (T), Inventories (I), and Operating Expenses (OE). By utilizing Throughput Accounting, it is amazing how any management team can quickly and easily identify core problems in their businesses, create solutions to these problems, and achieve heights of profitability not previously thought possible. Traditional cost accounting systems are by far and away the largest impediment to productivity, with some even going to far to describe them as an “enemy of productivity.” Throughput Accounting is the solution managers and accountants alike have been searching for so let’s dig into it!
Throughput Accounting 101

For almost 200 years accountants have been charged with helping organizations make decisions utilizing financial information. For the vast majority of that time, allocation-based methods of accounting have dominated the landscape and are integral to almost every business decision made today. However, despite the ubiquity of allocation-based forms of cost accounting including activity based costing, standard costing, job costing, and lean accounting to name a few.
All suffer from the same set of problems, namely:
- Cutting costs is prioritized over creating flow in the business.
- Throughput is not well understood or managed.
- Allocations distort the manager’s ability to clearly understand impact of decisions.
- Allocations encourage the building of inventories to increase profits.
- Reductions in inventories are not valued as importantly as they should be valued.
- Product Costs do not reflect true cost of capacity consumption and lead to poor decisions.
- Pricing methods are cost-based, not value-based and conflict with the goal of generating profits.
These numerous shortcomings, among many more for each specific form of cost accounting are well known and documented within the accounting community. In fact, in the book Relevance Lost, by Norton and Kaplan, these same shortcomings are identified as generic flaws in all forms of cost accounting. What the authors did not realize, was that their invention, Activity-Based Costing was also plagued by the same problems they so aptly described in relation to other forms of cost accounting.
Cost Accounting Definition / What is Cost accounting?
The rules and process developed by companies to support the notion of cost absorption. This is to say that products are viewed as creating all the costs of a company; thus the need to decide how much of the company’s expenses are attributed to a particular product. The process of attributing expenses to products is known as the allocation process. Between the various cost accounting methods (Actual, Standard, ABC, etc.) the main difference is in their respective allocation processes. A few of the differences would be which costs are allocated, what is the “driver” or allocation base, and at what level of the organization these costs are allocated (unit, batch level, product line level, business unit level, etc.).
However, despite the numerous methods and their associated shortcomings, a robust form of accounting was developed and made public in the early 1990s. This form of accounting is known as Throughput Accounting, and was developed in tandem with new production methodologies focused on developing significant increases in flow. Dr. Eliyahu Goldratt created Throughput Accounting and documented its major components in The Haystack Syndrome. Subsequently, Throughput Accounting was integrated into the all-time best selling business novel, The Goal (click for –> The Goal book summary) as Dr. Goldratt felt Throughput Accounting to be imperative to supporting flow-focused companies. Unique to Throughput Accounting is the fact that it is not plagued by the common set of problems that cost accounting systems experience. Indeed, many times Throughput Accounting suggests decisions which generate significant improvements in profitability for a company that are in direct contradiction to the decisions cost accounting would recommend.
Throughput Accounting largely ignores most aspects of accounting that other methods consider to be of the utmost importance, instead focusing and relying on the few elements needed to determine if a decision will yield positive or negative financial results. Those few elements are known as T, I, and OE and are defined below:
Throughput (T) – The rate at which the system makes money (through sales).
Throughput can also be defined by examining the relationship between the two components that represent Throughput, Revenues and Totally Variable Costs (TVCs or also called Truly Variable Costs). Revenues share the commonly accepted accounting definition of Revenues, namely the monetary value of sales transactions. Totally Variable Costs represent those costs which are TOTALLY VARIABLE on a 1 for 1 basis with the sale of a unit. Generally speaking, TVCs are material, outside processing costs, freight, and sales commissions if paid on a per-unit basis.
One item notably not included in TVCs is the concept of direct labor. Direct labor is not considered to be totally variable with production unless laborers are paid on a piece rate. In today’s operating environment almost all employees are paid in an hourly-wage scheme. Almost all employees that would be considered part of Direct Labor work a predefined number of hours in a shift, and a set number of shifts in any pay period (week, month, etc.). Thus, labor costs for any particular period are fixed and do not vary with production. One glaringly obvious example is that of when a machine breaks. The first words from any manager’s mouth will be, “#$%#! Now we’re paying these guys just to stand around!” It should be apparent that laborers are paid for their availability, not for their direct outputs. If the reader has ever managed employees, then he knows it is fortunate for most employees they are not paid on direct outputs as many would barely be able to make ends meet.
Inventories (I) – The money tied up in the system which will become Throughput at a later date.
Inventories are very similar to inventories as generally accounted for, with the exception that conversion costs of direct labor and manufacturing overhead are not attached to the products in inventory in any fashion. Rather, the only costs attached to raw materials, work-in-process, or finished goods are those that are considered to be a TVC when sold. This generally means material and outside processing costs.
A key distinction between Throughput Accounting and traditional cost accounting methods is that Throughput Accounting does not reward the building of inventories. In fact, only in Throughput Accounting is the true measure of inventories felt. From the basis of T, I and OE, we know that if we generate inventories in excess of those needed to support a given level of Throughput we as managers have merely lowered our overall returns by carrying too high of an inventory. No other cost accounting method would even suggest that carrying inventories damages returns or the future cash flows of a company. This is a significant and powerful distinction indeed.
Operating Expenses (OE) – The money the system spends to convert Inventories into Throughput.
Operating Expenses are what traditional cost accounting would recognize as Selling, General & Administrative Expenses along with the Conversion Costs of Direct Labor and Manufacturing Overhead which have been excluded Totally Variable Costs in Throughput. Throughput Accounting treats all expenses that are not totally variable with production as period costs and expenses them in the period in which they are incurred. Thus, instead of using a formula for manufacturing overhead to allocate a portion of a period’s Direct Labor being parked on the balance sheet, under Throughput Accounting the income statement would carry the full Direct Labor cost of the period.
With these three elements any financial decision can be evaluated. To ultimately judge decisions at local levels in organizations those decisions must be tied into the global objective and purpose of the organization. Utilizing T, I and OE allows for anyone at any level in an organization to immediately determine the global impact of a local decision. Without need for allocation, complicated activity analysis, or time consuming algorithms, T, I and OE accomplish the goal of managerial accounting in a succinct and highly effective manner. In essence, T, I and OE allow anyone to recast the financial statements with the effect of the decision stated within them. The ultimate arbiter of decisions is the bottom line and by utilizing only T and OE, anyone can determine the Net Profit impact (T-OE). Combining the net profit as determined by subtracting OE from T with the Inventory measure will quickly allow a manager to determine the a decision’s ROI. Given a net profit and the investment in inventory required to generate the net profit we quickly arrive at ROI (T-OE / I).

Company-Wide Decisions, Part 1 – Focusing on Costs is Costing YOU!
Given our basic overview of Throughput Accounting above, let us now direct our attention to the impact on common business decisions. Specifically, let’s look at how company-wide decisions are viewed from a Throughput Accounting perspective. To begin the discussions, let’s ask ourselves what should the correct priority be between our newfound tools of T, I, and OE?
The historical (and wrong) prioritization of T, I and OE and the precedence that cost accounting methods have established is as follows:
- Operating Expenses
- Throughput
- Inventories
The reason for this prioritization is very clear in the mind of a cost accountant. We, as managers are focused on the bottom line, or Net Profit. The factors that contribute to Net Profit are obvious: Throughput and Operating Expenses. Inventories do not even enter into this equation. Additionally, the traditional cost accountant does not see a linkage between what measures he suggests for use in performance evaluation and inventories. Thus inventories are relegated to the lowest priority in terms of focus and attention from cost-world managers.
This leaves the traditional cost accountant only to choose between Throughput and Operating Expenses. No easier choice has ever been made. First, Throughput is not controllable. It’s definitely not an area of responsibility for the cost accountant and it certainly would seem to most that sales and marketing barely have a handle on it themselves. Secondly, the cost accountant has no tools that impact Throughput. All of his tools are oriented at identifying costs and driving them down or more efficiently utilizing them. Thus placing Operating Expenses as the most important item on our managers’ list is very clearly established.
Unfortunately, this prioritization fallacy rarely goes challenged and is so widely-accepted to be viewed by many simply as a fact of life. However, let’s go back and double-check a few of the key assumptions behind this management model of OE, T, and I.
While any improvement methodology has its own specific approaches and tools, all share one common thread, especially these days: Companies must CONTINUALLY improve. One-time improvements are not enough. We cannot be like the hare and only seek to run the race when it is convenient. We must take the turtle’s approach of constant effort in order to win the race. Granted if we could combine the hare’s speed with the turtle’s persistence, we’d have the best of both worlds… but I digress.
Thus if continuous improvement is our goal, which of the three measures of T, I and OE best align with continuous improvement? The answer it seems is quite obvious. T and T alone offers the only avenue for continuous improvement. Continuous improvement by nature is not limited. Thus, we see that I and OE both cannot support continuous improvement efforts as they are inherently limited. Can you think of a vendor that would pay you to purchase his product? Is there a landlord that will pay you to occupy a building? I would love to hear the stories of when this happened, but it is not commonplace nor expected. As we know, I and OE are limited by their existence and can go no lower than 0. T is not constrained in such a manner and can be forever expanded … if we continuously improve that is.
That leaves only OE and I. But before we declare OE a close second to T, we must check our previous assumptions. Is it really true that Inventories do not enter into the Net Profit calculation? What of carrying costs? Surely those expenses are included in Operating Expense. This would be a direct example. Can we think of any indirect impact of inventories? What have lean, TQM, JIT, Six Sigma and all the other improvement fads taught us? Inventories DO have a SIGNIFICANT impact on operating expenses. Take for instance the case of holding high inventories in the face of changing customer demands. This results in very high OE indeed. Not only that, what is the impact of holding inventories no one wants? We lose future Throughput! Furthermore, all the improvement fads would suggest Inventories are THE KEY factor to monitor to ensure having Throughput in the future. Thus it is safe to say, to support continuous improvement and growth of Throughput, Inventories MUST be second only to Throughput itself.
This leaves Operating Expenses in third place. In fact, I would classify Operating Expenses a distant, far-removed third. Why you ask? What has been occurring at every organization over the last 30-40 years? Managers of companies have done their very best to squeeze blood from a turnip. They have leaned and meaned their organizations until there are only very few opportunities left to cut costs without sacrificing quality or Throughput generation.
So the correct order is:
- Throughput
- Inventories
- Operating Expenses
This change in order may not seem like a big deal. But let me give you some examples of the damage that can be done:
- Short-term gains in cost savings are prioritized over protecting Throughput.
- Deferring maintenance saves money today, but causes us to miss due dates later.
- Purchasing lower quality materials that cause overall production to drop along with sales and profits.
- Worrying about the cost of transportation when a 10% increase in transportation costs could result in a 100% increase in the bottom line.
- Selecting suppliers who cause us to hold more inventories, exposing us to the risk of inventory write offs due to spoilage or obsolescence.
- Selecting the lowest bidder on a project only to have the project run over budget and past its due date. Oftentimes the company can lose more in profits due to delays than the cost of the project itself. (See South Carolina’s failed nuclear project.)
- Investing in projects with cost savings that never materialize.
- Cutting labor costs by installing robots. The manufacturing overhead rate formula leads managers to believe there will be a “cost savings”. The only issue is that we typically do not fire employees and in fact now need to hire a specialized operator for the robotics and spend additional money to train workers to use the robotics.
- Investing at non-constrained resources only leads to a negative ROI. We invest in resources to cut labor costs only to find that we had excess capacity to begin with and our investment has a negative ROI.
- Ignoring the massive opportunities for additional Throughput, staring right at us.
- Retailers celebrate when they sell out of goods, not realizing the lost profits due to missing sales.
- Project-based companies do not understand how their performance can significantly impact the ROI for their customers. Thus they select the cheapest sub-contractors and never give any thought to how completing a project faster could be competitive advantage worth paying a premium for.
- When performing job shop quoting, job shops and customer manufacturers spend a disproportionate amount of time on job costing not realizing they are ignoring the most important aspect of pricing – the margin!
- Organizations strive to have 100% utilization of resources and fail to see the benefit of reserving sprint capacity to utilize on hot orders…which could generate significant price premiums.
Can you think of any such examples? Let us know!

Company-Wide Decisions, Part 2 – Your ERP financials suck!
ERP or Enterprise Resource Planning software is at the heart of most companies. We use our ERP to plan and organize every aspect of our business including our financials. We use the financials that are produced by our ERP to make decisions. But what if we’re making the wrong decisions because of these ERP financials? After all your ERP financial module is based on the wrong order we discussed above and the same prolific cost accounting methods (activity based costing, standard costing, lean accounting, etc).
We have established that traditional cost accounting methodologies have skewed management’s financial priorities. Additionally managers have been lured by the claims of cost accountants and ERP vendors that only with sophistication and 100% data accuracy can we successfully lead our companies. So we go down the path of ERP implementation to capture the data we need to make good decisions. And involved in any ERP implementation team is your local cost accountant — which makes sense. Our cost accountant has a lot of information about our business and financials. But is it a good thing?
It’s not unlike when Jim has to begrudgingly work with Dwight Schrute in the TV show The Office. You just know he’s going to blow everything way out of proportion, add layers of complication to the project and wind up taking years off your life. Yet we know that if we leave the cost accountants off of the team we’ll miss that one key piece of data that could require significant effort to fix if we don’t get it right the first time.
By the end of the ERP roll-out, most companies are lucky if they can simply use their ERP to buy enough materials so they don’t shut down their production operations. Let’s not discuss tracking this inventory and actually invoicing for everything we produce, it’ll take another 3-5 years to get that right.
Yet for all the sophistication, efforts, and latest/greatest whiz-bang ERP modules, and all of the details cost accountants can dream up they have overlooked the most important element of it all: Throughput.
Think about all the effort you spent on your ERP, hundreds of man hours, tens of thousands (if not HUNDREDS of thousands) of dollars and you do not have the ability to quickly determine Throughput. As a result, without a lot of manual manipulation of your financials you lack the ability to state your financials according to the Throughput Accounting basis of accounting. Despite being so simple it can be extremely challenging to state information on a Throughput basis using your ERP data.
Before we examine the challenges, let’s first agree that there is in fact value to stating our financials in accordance with Throughput Accounting standards.

From Increasing Cash Velocity: The Theory of Constraints Approach to Cash Velocity by Dr Lisa Lang
One of the first things that strikes me is that most profitability analyses begin with determining a company’s breakeven point. With financials based on cost accounting principles there is no way to determine the breakeven point. It most certainly is not SG&A; nor is it the amount of expenses reported as cost of sales. Cost accounting literally hides and prevents managers from seeing one of the most basic and critical pieces of information. (See Dr Lisa’s ebook Increasing Cash Velocity for more information.)
Secondly, and much more importantly, as we discussed last time, is the fact that Throughput is truly the only way to grow and sustain our businesses. Yet go examine your financials. What would an outsider say you prioritized in your business based on your financials: Throughput or Operating Expenses? Sadly, most financial statements would imply that we care about Operating Expenses at about a 10:1 ratio to Throughput. For every one line that may be used to calculate there are at least 10 Operating Expense line items. Yet again we see that the cost accountants are guilty of having the wrong priorities and leading management down the wrong path. No wonder people think financial statements are useless: They’re right!!!
Back in my public accounting days the partner I worked for would oftentimes joke if he saw me mailing off financial statements to a client. He would tell me if I cared for the environment I would just go ahead and shred the financials and save the postage and handling. It really was for the best he’d say, because the clients were definitely not going to read those things. Ha!
Back to Basics TOC – Throughput Accounting
Here’s a video summary of what we’ve covered so far but with more discussion and examples:
PPT Slides from this TOCICO Webinar can be downloaded here -> Throughput Accounting PDF
Your P & L is lying to you!
Our Profit & Loss statement is the ultimate management tool; it’s where the buck stops. No matter how we think we did, the P&L has the last word. However, you may have noticed there are times when your P&L just does not seem to agree with your expectations. You thought you had a great month, yet the P&L tells a different story. The fact is, it’s not that your expectations are off, it’s your P&L that’s off.
However, the problem is not that you forgot a few invoices or that your math is off, if only it were that simple. There’s a few little-known assumptions your P&L uses to calculate its numbers and that’s where the problem resides. You see most companies use cost accounting and prepare their P&L statement in accordance with generally accepted accounting principles (GAAP), which has cost accounting principles embedded in it. This means that the financial statements are utilizing a method of allocating manufacturing overhead and direct labor to allocate expenses to inventory to ensure that inventories are “properly valued”. This is what your CFO and your CPA will tell you to do, but it’s actually the thing that is distorting the performance your P&L is reporting each month to you. Don’t believe me? Allow me to walk you through an example and see if you agree with me.
Let’s examine two companies, Inventories-R-Us and TA, Inc. These companies are exactly the same, in every regard, with only one difference: Inventories-R-Us uses cost accounting in its financial statements and TA, Inc. utilizes Throughput Accounting to report its financial statements. To state this in a different way, both companies have the same revenues each month. They also have the same amount of expenses each month, thus they should be reporting the exact same results each month.
So before we jump into the examples let’s understand a few terms and concepts. The first is that the P&L reports just one Cost of Sales (or Cost of Goods Sold) number. This number is comprised of three parts: raw materials, direct labor, and overheads. In our example I’m going to lump together the direct labor and overheads because they are both allocations. We’ll call these two items conversion costs when they’re lumped together like this. Also, when you see the balance sheet for the companies, instead of presenting the types of inventory (raw materials, work-in-process, and finished goods), we’ll be presenting the types of costs (direct materials, direct labor, and overheads). Our focus is on how these costs are moving in our financials, not what stage of production they are in.
So, let’s look at the P&L statement for these two companies for the first year:

What a difference! It looks like using cost accounting actually helps our earnings out significantly. At first glance, this certainly seems to be the case. But let’s pull back the curtain and see what’s really behind these numbers.
The first difference you’ll notice is that Inventories-R-Us reports both direct materials and the conversion costs (direct labor and overheads) as a reduction against revenues to determine gross margin. TA, INC. does not include conversion costs and instead only subtracts Totally Variable Costs from its revenues and then reports Throughput Margin.
Next we see that after both companies report their respective margins, the next section is different as well. Inventories-R-Us reports SG&A and then shows Net Profit. Meanwhile TA, INC. reports its Operating Expenses and then shows Net Profit. The first difference in this section is that TA, INC. reports much higher expenses in its Operating Expenses section than Inventories-R-Us does in the SG&A section. This is because TA, INC’s Operating Expenses section includes the conversion costs that Inventories-R-Us reported in its Cost of Sales section. But wait a minute, the conversion costs only represent a $50,000 difference. In total, Inventories-R-Us has reported only $350,000 in expenses while TA, Inc. has reported $500,000 in total expenses…where’s the other $150,000 you ask? Very astute of you. That would be the distortion I’ve been discussing here. To see where the $150,000 went we need to compare the balance sheets for these two companies.

Did you find them? Just like I said, cost accounting has parked the missing $150,000 on the balance sheet. Without know where to look, you could very easily miss them as they are typically reported – spread across and buried inside the categories of work-in-process and finished goods.
If you were to look only at the income statements, you might say the only real difference between Throughput Accounting and cost accounting would be the categorization of expenses. That is only one of the major, important differences (we’ll cover later why this categorization is so important later on…). The second important difference is the fact that Throughput Accounting does not allocate, which can only be identified when you look at your P&L in tandem with your balance sheet. Cost accounting is literally taking costs off of the P&L and deferring them to a later period by parking them on the balance sheet. Think about it, both companies have the exact same amount of labor expense – suppose it’s $100,000. Inventories-R-Us, because it uses cost accounting, only reports a portion of that $100,000 and puts the remainder on the balance sheet. Let’s say it was $50,000 of labor that was deferred to the balance sheet. Does that make any sense whatsoever? If you were managing Inventories-R-Us and you paid $100,000 in cash to your employees wouldn’t you expect you P&L statement to show the $100,000? I would and you should too. Unfortunately if you’re using cost accounting you will never see your actual expenses on your P&L. And just think, if you’re using cost accounting you are splitting your labor, rent, utilities, technology, and almost every other expense between your balance sheet and income statement. No wonder people find accounting confusing! Why don’t we stop playing the games and just report the real numbers as they are?
So, we have now figured out how cost accounting allocates costs to inventories and in doing so distorts the income statement. When this allocation process occurs, cost accounting principles dictate that you remove the expenses from your P&L and places them on the balance sheet. The net result is that you can’t see what’s really happening on the financial statements.
This time we have a similar, but slightly different example to show you how cost accounting distorts the P&L on an ongoing basis and how you can identify it. So let’s look at the income statement for Year 2 for these two companies”:
 We again see that Inventories-R-Us has reported much higher earnings than TA, INC. So let’s do like last time and go to the balance sheet and see if we can find the distortion:
 Did you find it? What do you mean you don’t see the deferred expenses, they HAVE to be there right? Oh, wait a minute. I know what’s going on here… let’s take it a step at the time. To begin, let’s answer this question: What amount of expenses are being deferred? We can find this by comparing the total expenses reported between the companies, for all categories. Let’s see what this is:
 Ok, now we know we’re looking to find $250,000 buried SOMEWHERE on Inventories-R-Us’ balance sheet. Well, I’m not good with numbers, but the last I saw of their balance sheet it showed $400,000 in their inventory section. I have a hunch of how they hid the money…let’s see if it’s true.

There it is! They have simply added it to the balance from last year. So if we subtract the balances between two periods we can see how many expenses were deferred each period. Got it… but what about that $75,000, why didn’t we include it in our deferral calculation? The reason is if we were to look at both Inventories-R-US and TA, INC., they are both valuing their raw materials properly, at the price they paid for them. So both companies report the same amount of raw material inventories. So yes, the raw material balance went up, probably because they both bought more raw materials, however, we do NOT include this change in our deferred expenses calculation because both companies treat this the same (you can go back up to the balance sheets for both companies and see they both reported $150,000 in raw material inventory, thus we know the income statement difference cannot be attributed to the rise in raw materials).
This is pretty amazing. Inventories-R-Us has not only deferred $150,000 of expenses from Year 1, but additionally, another $250,000 of expenses from Year 2. This isn’t a fair fight! So why don’t we just all use cost accounting and always report higher earnings each period to the bank and call it a day? Unfortunately…. I’m afraid this isn’t always the case as we’ll soon see.
If you got all that down pat you’ve mastered some tough stuff. The cost accountants don’t make it easy, but we’re hot on their trail. Now let’s address head on, once and for all, why cost accounting really is distorting our reality.
We now know cost accounting can allow a company to just keep on deferring expenses, month after month, year after year. The deferred expenses just simply keep on adding and adding, growing ever larger. This means their reported earnings just keeping looking better and better as compared to Throughput Accounting’s. This is true…for a while. Let’s take a look at Year 3 and check in on our two companies.
Here’s the story of what’s happened in Year 3 from the CEO’s of Inventories-R-Us and TA, INC:
- We had an OUTSTANDING YEAR!
- Our sales of units were the HIGHEST EVER!
- In fact, we couldn’t keep up with demand and our customers almost drained our inventories completely!
Well this certainly sounds great. So I’m expecting both of our companies will be reporting their best year yet! Can you imagine how high the stock prices of these two companies will go? Let’s check out these awesome results. Here are their P&Ls for Year 3:

What in the world?! Why did Inventories-R-Us have a LOSS when they said this was their best sales year EVER? How can they almost SELL OUT OF INVENTORY and then turn around and report the WORST YEAR EVER! We should fire the CEO immediately!
Meanwhile, TA, INC. has reported its best year ever! This year’s Net Profit was 20% higher than last year. This is cause for celebration! It really was their best year ever!
Has this been you? You felt like you had an AWESOME month, only to find out the results were TERRIBLE? The fact is, cost accounting can distort results in both directions: up AND down. So by now, you probably know the drill, we’ve got to go check out what happened to inventories in the balance sheet. And we also know that because we aren’t in the first year, we’ll need to compare Year 2’s balance sheet with Year 3’s balance sheet. Let’s see the numbers:

Can you believe what you see? So here’s the deal, in Years 1 and 2, both Inventories-R-Us and TA, INC. were carrying more and more units of inventory in reality, thus their balance sheets grew in the inventory sections. Now, TA, INC’s only grew by the amount of raw material growth, whereas Inventories-R-Us deferred operating expenses onto the balance sheet. This is all fine and dandy for Inventories-R-Us so long as inventories GROW. But what happened in Year 3? Well, these two companies finally hit their stride and had a great sales year, so good in fact that customers were buying finished goods faster than our companies could produce them, thus inventories fell. When inventories drop from year to year, if you’ve been deferring expenses like Inventories-R-Us has been, your P&L is getting ready to get WALLOPED, BIG-TIME!
That’s exactly what happened here. Inventories-R-Us saw its inventory balance drop $300,000 from Year 2 to Year 3 and guess where that $300,000 went? You guessed it, straight to the bottom line. This is why in your business when you feel like you have a GREAT month you can have TERRIBLE results on your P&L.
What a trap! So if you’re managing by using cost accounting in your business, the ONLY way to truly maximize your profits that you report is to MAKE INVENTORY GROW! Geez…that sounds bad to me. I’m no operations expert or anything, but I thought all the modern-day improvement initiates told us to get rid of inventories. I sense a conflict: grow inventories to report my best earnings OR cut inventories to protect our future profitability. Hmmm…which one shall we do?


Value Add – A False Notion
If you’ve read the series on how cost accounting and GAAP are causing your P&L to lie to you (if not, scroll up), I have some bad news….they’re also messing with your balance sheet. Recall from the P&L series that the reason your P&L was so distorted was because the accountants decided to take costs off the income statement and allocate (aka “park”) the costs on the balance sheet. So not only did they distort the P&L, they also distorted the balance sheet in the process. Now, of course the cost accountants aren’t telling you this is what they’re doing . They use euphemisms like, “capturing the value add of our processes.” When these costs are allocated to the balance sheet from the P&L, the inventories reported on the balance sheet are much higher than they otherwise would be if we had not allocated the costs. This is the distortion on the balance sheet, and it’s critical you understand this distortion just as much as you understand the P&L distortion.
“Value add” Definition – the false notion in cost accounting that creating inventory creates value. Cost accounting encourages building inventories by allocating expenses to inventories to properly “value” inventory instead of placing the expenses on the P&L – where they belong!
Product Cost Definition
At first glance, this distortion may not seem to be such a big problem at all.
- We know inventory has value because once it’s sold it will supposedly sell for a price much higher than its cost, even if it is the inflated “product cost” we love to hate.
- Many banks will lend credit based on of the value of the inventory, so the fact that we are able to increase the value of the inventory can help liquidity.
- We must in our accounting systems capture the amount of value that is being added to products for GAAP reporting
Although these claims may have some truth, they certainly aren’t the whole truth. For instance, how much “value add” does inventory have when we have to pay taxes on its value at the end of the year…not so much. Furthermore, what if inventory goes bad by the time we get around to having another order for it? Or goes missing, or gets damaged, and on and on? So, while some of these arguments contain a grain of truth it’s also true that there are a number of critical factors missing from this traditional view of inventory and its valuation, especially when it comes to running companies and making decisions.
So why do I claim there is a problem with this notion that inventories have a “value add” that must be captured? It’s because in my mind inventories have very little to no value to the extent they are not needed to support the creation of Throughput. Anything beyond what is needed is a huge waste of time, money, and resources. And I’m not the only one saying this either.
Have you ever examined any of the improvement methodologies of the last 30 or so years (If you DON’T live in a cave, the answer is YES!)? You probably noticed a common theme amongst them all. The thread that is shared between all the improvement methodologies is the fact that they all strive to reduce inventories to as low a level as possible. TQM (Total Quality Management) identified how having large inventories separates the identification of quality defects from the source of the defect. JIT’s (Just In Time) position on inventories is fairly evident….just in time to be used. Lean also shares these views, and if you ever read Liker’s book Toyota Way, the metaphor of a river is given to illustrate the level of inventory in a company. The goal then is to always decrease the level of this river (the amount of inventories) to identify rocks (problems) that stop flow.
Despite the fact that many of these methodologies devolve into a multitude of unintended consequences (Jammed-In-Trucks = JIT), cost cutting (Lean) and ultimately lip service (TQM), they do have the correct notion in viewing inventories as a liability to a company, not an asset.
Inventory is a liability, NOT an asset!
This assessment of inventories flies in the face of traditional management practices, especially those centered around cost accounting. Under any of these improvement methodologies, you as a manager are encouraged to cut batch sizes, lots, etc. in order to reduce inventories. Yet traditional management techniques utilizing cost accounting-based rules (batch sizing, setup “cost” reduction, etc.) encourage managers to run larger and larger batches to gain “efficiencies.” It seems as if though our friends in cost accounting have missed the mark yet again. In fact…didn’t we just say inventory was viewed as a liability to be reduced by all of the various improvement methodologies? Remember where the cost accountants are putting those expenses they are taking off of your P&L? You guessed it: INVENTORY! The LAST place on the balance sheet that actually has any value according to ANY improvement methodology! What in the world are these crazy cost accountants thinking?!
Alright, alright. I know what you’re thinking…I’m not going to ask a cost accountant why they do this crazy stuff. It’ll take 2 hours to get the explanation and I won’t even remember what I asked them! By the time they pull up all 17 of their spreadsheets to show me 400 numbers taken to 18 decimal places I’ll be counting the ceiling tiles, ugh! Don’t worry, just like Tom Smykowski handles the customers in Office Space, I’ve handled the cost accountants for you.
So….yeah……In discussions I’ve had with a former FASB chairman (you recall, FASB is the club of accountants that make all the bad rules), I described to him how Throughput Accounting views and values inventories: only at their Totally Variable Cost (TVC). In other words, Throughput Accounting only allows materials, freight, and purchased parts into inventory and they are valued at what the company paid for them. Nothing more, nothing less.
Well, as you would imagine, the former FASB Chairman immediately bristled up and refused outright the claim that inventories should be carried only at their TVC value. I was told that this would represent a gross underestimation of the “value” of the inventories and would mispresent the financial statements to the extent that users of the financials would be misled because these inventories were not properly “valued.”
Needless to say, the former FASB chairman is on the side of allocating expenses by using a formula for manufacturing overhead. But, recall, if we are allocating, the only way to maximize our profits is to always be BUILDING INVENTORIES. But, if we do that, how then can we possibly improve if all the improvement methodologies are telling us to CUT INVENTORIES! Don’t you find it odd that the accounting community ascribes value to inventories and considers them assets when almost every other function in the business world would say inventories are liabilities?
Let’s see if we can figure this one out. We must figure this out if we are make any progress. We need to know, does cost accounting get it right when the cost accountants claim that inventories, especially as they begin the production process, have value added to them? If inventories do in fact have value added to them, building inventories would be a positive thing. Thus the question is whether having larger inventories as cost accounting suggests is preferred over having smaller inventories as Throughout Accounting would recommend.
Cost Accounting Encourages Building Inventories
Let’s examine why cost accounting’s theory that inventories have value, leads cost accounting systems to recommend larger inventories as the preferred mode of operating.
Well, it all begins when cost accounting shows up in our production planning. In most environments, cost rates are established for each work-center and as products pass through the work-centers costs are added in proportion to the time that products are processed at each work-center.
Cost accounting makes the assumption that units of inventory increase in value in proportion to the time and cost of the processes applied to them.
Now, in any operation, all the costs assigned to a work center occur in one of two time periods: setup or run. Thus, in a cost accounting model, each time the machine is down for a changeover we are “incurring” setup costs and likewise, when it is performing its operation we are “incurring” run time costs.
The question traditional cost accounting grapples with inside of production systems is — what is the optimum batch size to run, given the amount of setup “costs?” This dilemma is managed with a concept known as EBQ, or economic batch quantity.
Essentially, EBQ says given the amount of setup “costs,” how can the company best minimize total product cost by spreading the setup cost over an optimum number of units. Suppose a customer places an order for 2 units of a product. Let us also say the setup time of this product is 3 hours. Well, instead of spreading the “setup costs” over 2 units, what if we made 10 units, or 100 units, or 1000 units? Obviously, as we make more units the lower the supposed “product costs” will be per unit
Now, what about the fact that our customers have only ordered 2 units and we are gearing up for an all-out assault to produce 1000 units? Well….the thinking is that we’ll sell them…sometime….later…Riiiight? That’s a problem for later down the road, and at any rate we are minimizing “costs” today, so that has to be the best decision, right? Dollars saved today are better than dollars spent today. Thus, in many firms, the production planners issue work orders for production quantities well in excess of required or demanded units from firm orders. They do this all in the name of lowering “costs.”
But wait, there’s more …
We should also note two additional negative impacts cost accounting has beyond the planning of batch sizes. First, let us suppose you manage one of the work centers of a manufacturer. How would you manage the work-center if your company utilized “product cost” as defined by traditional cost accounting systems as the basis for performance evaluation? I know it would be my main goal each day to minimize the time my work center processes any particular order. By minimizing this time, I would be, supposedly, reducing the “cost” of producing the units.
For example, let’s say there are three work orders, WO11, WO12, and WO13 that were planned to be processed in sequential order at my work center. Also note, WO11 and WO13 are identical products; however, they are going to different customers. Let’s also assume we pay labor at the rate of $10/hour, allocated overhead costs are $50/hour for a total of $60/hour of costs. Each work order has the following production characteristics:
| Work Order | Setup Time (hours) | Run Time (hours) | Total Time (hours) | Setup Costs | Run Time Costs | Labor + Overhead Cost |
| WO11 | 2 | 2 | 4 | $120 | $120 | $240 |
| WO12 | 1 | 2 | 3 | $60 | $120 | $180 |
| WO13 | 2 | 2 | 4 | $120 | $120 | $240 |
| Summary | 5 | 6 | 11 | $660 |
*Costs are $60/hour
Now, the production scheduler certainly did a good job. He scheduled each of these jobs based on their due date requirement. However, what he did not consider was the impact of this schedule on my work-center’s performance. Recall, the longer a product is processed at my work-center the more it “costs” and my managers are always riding my case about getting my “costs” down.
Well, as luck would have it, I see a way to reduce our “costs” that our scheduler did not see. I’m not saying he’s a bad guy, he just doesn’t know my work-center as well as I do. The issue is if the work-center were to run the jobs in the order he’s planned we’ll have more process time in total than if we run it according to the way that minimizes our “costs.” What the scheduler didn’t know when he made his plan was that my work-center is already setup for WO12. The reason is that the last work order we ran, WO10*, utilized the same setup.
So instead of running WO11 first, if our work-center runs WO12 first we will save its setup time. Win. Now that WO12 is out of the way, that means WO11 and WO13 will run together. If we run those two work orders together, guess what? We’ll save the setup time on WO13 because we’ll utilize WO11’s setup (remember it’s the same product as WO13). Win-Win. I have just single handedly “saved money” on two out of three jobs by reducing the total run time and the associated labor and overhead charges to these products.
| Work Order | Setup Time(hours) | Run Time (hours) | Total Time (hours) | Setup Costs | Run Time Costs | Labor + Overhead Cost |
| WO12 | – | 2 | 2 | $0 | $120 | $120 |
| WO11 | 2 | 2 | 4 | $120 | $120 | $240 |
| WO13 | – | 2 | 2 | $0 | $120 | $120 |
| Summary | 2 | 6 | 8 | $480 |
*Let’s assume WO10, which has the same setup as WO12 was the last job we finished the day before our example takes place.
*Costs are $60/hour
Would you look at that, we saved close to 30% of the “costs,”; now we’re really making money! Unfortunately…we know this simply isn’t true. We didn’t fire anyone, we didn’t cut off the lights, we still had the same managers, etc. So in reality, NONE of the expenses changed.
However, despite that fact, many managers believe if we operate as we did in the example we will save “costs.” What’s the reality? Well, the expenses don’t change, so there are no “savings.” And, in fact, operating in this manner only serves to build inventories and create problems later down the road.
For instance, suppose our work center is the first step in our manufacturing process. What if the production planner had scheduled these jobs so that all the necessary components arrived at our assembly operation at the same time so that the finished product could be assembled? What happens is the assembly department has 98% of all components, except for the ones our work center was supposed to make. This means the assembly department has to be idled until our work center finishes these parts.
Also, let’s say WO12 will go to assembly next. Now the assembly area is jammed full of WO12’s parts when what they really need is WO11’s parts. What do you think the assembly supervisor screams at the plant manager? EXPEDITE WO11, NOW! The net result is that we have MORE inventory on hand than we should have, chaos on the shop floor and nothing to show for all these supposed “cost savings.” This effect is only exacerbated as production times for the various components increase.
So now we are aware of how cost accounting encourages, causes the creation of, and actually rewards companies for creating inventories. Batch sizing leads planners to unnecessarily increase batch sizes to save “costs”, shop floor supervisors are forced to prioritize “saving costs” instead of focusing on creating product flow, and finally our financial statements actually reward all of these terrible decisions by taking expenses off of the P&L and throwing them onto inventories. It truly is a vicious cycle.
How Inventories Create Value Add
Now, armed with this knowledge of how cost accounting encourages inventory building, back to the value add discussion.
In terms of how inventories can generate value add, there are three broad categories of potential value add as were documented in the book The Race, written by Bob Fox and Eli Goldratt:
- the product itself,
- price of the product, and
- finally, the supply of the product to the market.
These notions of value can be viewed from either the supplier or consumer’s perspective. For the supplier, to the extent they excel and can lead their market in one of the categories represent the supplier’s ability to generate throughput-margin. For example, you could say Ferrari can pull off premium pricing, thus this creates higher Throughput-margin for their sales of cars. From the consumer’s perspective these categories represent needs or desires that if sufficiently met, the consumer is willing to pay. Each of these categories can be further divided into .
 As we examine each of these six key components, if cost accounting’s claim regarding inventories having value added to them is correct, then building inventories (i.e. making something (inventory) that IS worth something (i.e. really has value) would be the direction our accounting system should be leading us to go. However, if we discover that when we are building inventories we are NOT creating value, then our accounting system should encourage us to reduce inventories and the associated damages caused by them. Thus the real question we’re asking is this: Does building inventory create value across these categories and components of value?
To answer this question, let’s examine the from the reported financials of our two favorite companies: Inventories-R-US and TA, Inc. Recall that Inventories-R-US utilizes traditional cost accounting whereas TA, Inc. utilizes Throughput Accounting. Under a traditional cost accounting system, increasing inventories is encouraged. In fact, having larger inventories is rewarded with lower unit costs and a more profitable P&L. This fact leads to very different operating characteristics between Inventories-R-US and TA, Inc. You see, at Inventories-R-US, the goal of having lower unit costs has led management to believe that having bigger batches in production leads to lower product costs. Why? Well if you run bigger batches you can take the setup and run-time costs and spread them over more unit, which supposedly means that the products “cost” less. Meanwhile, across the street at TA, Inc. Their focus is on minimizing inventory. At TA, Inc., batch sizes are reduced as much as possible without hurting the flow of goods. Thus, Inventories-R-Us shall be considered the high inventory environment while TA, Inc. shall be considered the low inventory environment.
(If you read “Your P&L is lying to you!” up above, you get a sense that these two companies are like the coyote and road runner cartoons. We already know the winner and loser, but we gotta see just how bad the ol’ coyote can screw it up.) 1. Value Add: Product – Quality
The first key component of inventories’ potential value stems from the quality of the products in inventory itself. If you have ever purchased a product only to have it become defective within a short period of time you know how frustrating low-quality products can be from a consumer’s perspective. In a business to business environment, having a defective raw material can shut down production, which can cost huge sums of money. Needless to say, quality is very important. Establishing and maintaining product quality has now become deeply embedded in all aspects of our companies’ operations, from the issuance of a PO, to final inspection and everything in between. It is now all but the de facto standard to have ISO 9001 stamped on everyone’s business cards, from the janitor to the CEO, to demonstrate your company’s commitment to quality (Are ISO 9001 bathrooms cleaner?…I digress). But what is the role of cost accounting and its impact on inventory in all of this?
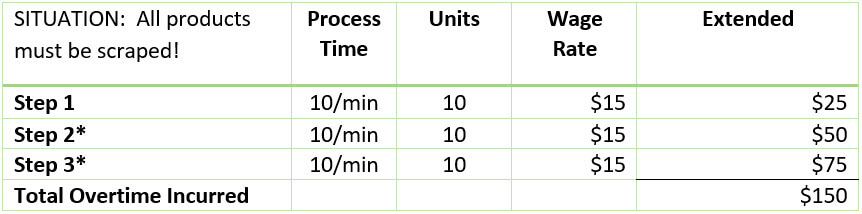
Well, where do you typically find defects in your product inventory? It certainly is NOT prior to the point of processing raw materials. The most frequent point is that of the final inspection. Given this fact, suppose at Inventories-R-Us and at TA, Inc., the respective QC teams find a defect on the first part off of the line for a special order for the companies’ best customer. Let’s say the customer ordered the red product but the shop floor used the blue dye instead. All of the products produced must be scrapped! How could these guys have made such an obvious error (I bet the bill of materials in the ERP was wrong since it was a special order…)?!
Well, we might as well go ahead and see how much the write-off will be. Let’s pull up our Excel sheet and compare the differences in write-offs between the companies. Here’s all the relevant information:
Note: our examples will ignore any overheads. Why? They are simply allocated costs (see: made up, imaginary, etc.) and not REAL cash costs. Recall from previous posts that Inventories-R-Us parks costs on the balance sheet whereas TA, Inc. simply just goes ahead and expenses direct labor and overhead each period as they are incurred. Well, the short of it is that you pay the same under each method, the only difference is that the figures are reported in different places at different times. But, if you’re paying the same, the expense IS the same. We’ll assume too that we have to rerun the products and that all of that time will be overtime, so there is an actual labor impact on cash as well, in addition to needing more raw materials.
Production Information (for both companies):

Inventories-R-Us Material Write-off:
 *Remember, to get to these Steps we had to consume all the raw materials of the prior steps.
Inventories-R-Us Overtime Charge:
 *Remember, to get to these Steps we had to rerun the units through all the prior .
Man, oh man did Inventories-R-Us get hosed by such a simple error! Inventories R-US lost $150,000 in material AND had to pay $15,000 in overtime labor for a total loss of $165,000. That will certainly be fun to explain at month end. Let’s take a look at TA, Inc. and see how they fared.
TA, Inc. Material Write-off:
 *Remember, to get to these Steps we had to consume all the raw materials of the prior steps.
TA, Inc. Overtime Charge:
 *Remember, to get to these Steps we had to rerun the units through all the prior Steps.
Hmm. TA, Inc. only lost $1,650 bucks on this. I’m not advocating losing money…but this isn’t so bad. It’s quite manageable in fact. It sure beats blowing $165,000…that could be a nice house in some parts of the country! So let’s see what the major differences were.
Example Summery: Loss of $165,000 (with Costing Accounting) vs $1,650 (with Throughput Accounting)!
With Inventories-R-Us the batch sizes were much larger, 100x larger in fact. By having such larger batches, a number of negatives emerged. First, it took longer for the QC inspector to get his hands on the first unit. This is simply due to the time required to process all of these units. If Inventories-R-Us operates like most companies, they transferred all 100 units at roughly the same time to the next step in the process. Thus, until all units in the batch were processed none of the completed units were transferred to the next step. This means the shop floor was still producing a ton of defective units until the QC guy finally figured this out. Secondly, because each batch was larger, Inventories-R-Us had already committed more raw materials to the order, meaning the cost of scrapped raw materials was much higher for Inventories-R-Us than TA, Inc. Finally, because each batch is larger at Inventories-R-Us it takes more total time to complete a batch at each step in the process. This means to rerun the products (correctly this time we hope) in the same manner it will require much more labor expense for Inventories-R-Us than it will for TA, Inc.
So, cost accounting told us to run with larger inventories in the form of bigger batches, but clearly this is a very expensive proposition. If we increase the batch sizes we’re also finding defects later, wasting more raw materials, and wasting more time. Also, we don’t live in the perfect world that these two companies do. That means we’re running OVERTIME typically to fix these issues, which is much more expensive than just regular pay. Additionally, we’re probably going to need to expedite this order now because we have taken so long to find the defect, which means confusion, chaos, and will likely result in late orders (or expensive freight!). It looks like having low inventories here is the clear winner in terms of Product – Quality. But this is only 1 of 6 key components to inventory’s value add proposition, let’s see how the analysis shakes out over the remaining 5 categories.
2. Value Add: Product – Design & Engineering
The second form of a product’s supposed value add in inventory comes from the product itself. Now, I’m not saying that making a product adds value, I’m saying there are things about the product itself that result from product design & engineering that make the product more valuable to a consumer as well as to the manufacturer. For instance, think about the automotive industry. In the last 10 years or so Bluetooth connectivity, keyless start, autonomous driving features and number of other innovations have been made standard on almost all cars. Certainly, it would be much nicer to have a car made in the last 2 years than one made 15 years ago. But what does all this have to do with inventory? Well, push to start buttons have been around for approximately 100 years (think of any common machine). Bluetooth was on phones back in the year 2000. Believe it not, the origins of the autonomous car go back to the 1920s. Why then do you think it has taken so long to build such mundane and dated technology into cars? The reason is inventory.
See, when the automakers design a new car, they have to go to all of their suppliers and setup contracts to deliver the new parts. One of the latest trends for automakers has been to implement what is known at Just-In-Time (JIT) inventories. That is, the inventory for the automaker shows up exactly when the vehicle is rolling down the assembly line to be integrated into the vehicle. The only problem with this model is that JIT means something much more than just in time. The common understanding of JIT would be Jammed-In-Trucks or Just-Isn’t-There. You see the automakers have JIT, but none of their suppliers do. They are the ones now stuck with carrying all the inventory of the automakers. Thus, if you are a supplier having to carry tons of inventory for the automakers, how often would you like for them to change the components they are purchasing from you? NEVER! Every time the automaker decides to change something about the parts you make, guess what happens? All the inventory you’re holding in stock just became USELESS! Add to that fact that multiple suppliers who may have staggered contracts must now produce different components and it’s easy to see why it takes so long to integrate new innovations into vehicles. At least major model changes happen only once every 3-5 years, right?
That’s true for the automobile industry, but what about the tech industry? I remember a time between 2006-2012 when it seemed like every company was releasing a new model of cell phone every 3-6 months! Can you imagine the dilemma of the supply chain manager when a new phone was released? Do I delay introducing the new model, but what of my competitors? No, we MUST release the new device. So, do I kill my profits, discount today’s inventories and flood the market with the existing phones? No, that would kill demand for the new device. But what other options do I have? Scrap the phones? But we have MILLIONS invested in them!
Unfortunately, it is the huge amount of inventory we are holding that oftentimes dictates our decisions and ultimately our profitability. Yes, we must innovate and deliver great products to the market. But if our own inventory is literally standing in our way, then it doesn’t matter how fantastic the products are, we will ultimately suffer due to having high inventories on our balance sheet. Thus, all the more reason to hold LOWER not HIGHER inventories as cost accounting would suggest. Low inventory means we can introduce changes to our products much faster and we won’t have to sacrifice profits due to existing WIP or finished goods. This also can manifest in giving us the ability to introduce new products at a faster rate than our competitors. This means better product hits the stores’ floor much sooner, which can get us a real advantage when it comes time for a customer to make a decision.
3. Value Add: Price – Profit Margins
Continuing our analysis brings us to the fact that inventories have significant impact on the profitability of company by way of profit margins. The first way that inventories impact profitability is by causing the company to incur unnecessary expenses, commonly referred to as carrying costs. Companies with high inventories are also required to have higher than necessary capacities to accommodate operating with such high inventories. This in turn leads to having operating expenses well in excess of what’s actually necessary for a given level of output; most notably high inventory companies have excess labor and capital expenditures relative to low inventory companies. Let’s take a deeper look at these two aspects of inventories and their impact on profits.
We all know that inventories are linked to profit margins via carrying costs, otherwise known to be the cost of spoilage, damaged goods, theft, and all of the administrative effort that goes into tracking and managing the physical inventory itself. 
It sounds so simple that you wouldn’t think managing inventory would be such a big deal, but I can’t tell you how many times I’ve seen companies with CRITICAL issues in their inventory management. I had an audit client in the aerospace industry that utilized pre-impregnated carbon fiber in their products. The carbon fiber comes prepreg’d with a resin that has three conditions that MUST be met for storage: a -10 degree Fahrenheit temperature, total exposure to oxygenated environments of less than 10 hours, and a 1 year shelf life. If you don’t meet these conditions, the resin begins to react and sets up. Do I need to even tell you what a disaster the situation was? First, the purchasing department bought enough carbon fiber on their opening order for the first 6 months of production at the facility in order to capture vendor discounts on volume. As soon as it arrived, it overwhelmed the freezer space the company had, which was only designed to hold at most 3 months of inventory. Not only that, there are variations in the carbon fiber, of course. Let’s say there is a Type A, a Type B and a Type C. Well, how easy to you think it was to find Type C, intermixed among the Type A and Type B in the overcrowded freezer? Nearly impossible. Thus, every time the company needed to pull inventory, they had to unload about a quarter of the freezer just to find the ONE box they actually needed. Recall, all the material must be kept below -10 degrees Fahrenheit and not be exposed to oxygen for more than 10 hours. Thus, every single time they pulled out the inventory they risked holding the inventory at too high a temperature and started running the oxygen “clock” if you will.
This whole series of events was started in January of that year. Needless to say, by the time I showed up to do the inventory count the next January 1, the company had material scrap costs nearly double their material consumption costs each month and had already installed a second, $500,000 freezer to hold the excess inventory. Also, because the freezers were so overwhelmed with inventory the company couldn’t identify all the carbon fiber the ERP said was on hand, so between the expired, spoiled and missing inventory the company incurred a write-off equal to about 50% of their inventory value at year end after I finished with them. Again, something so simple can spiral so far out of control such that it has devastating impacts on the bottom line.
However, inventories also impact profit margins via another avenue – by way of their impact on operational flexibility. Recall from earlier how cost accounting leads us to “optimize” our batch sizes…typically resulting in batch sizes that are much larger than what is needed, and inventories rise as a result. This rise in the level of inventories, WIP in this case, fills our productive and protective capacities with inventory – whether it is needed or not! Now, I know, at YOUR company this NEVER happens. You only produce what is sold, right? I mean, you take the sales forecast and make exactly what the sales team tells you is needed. Isn’t that what the forecast is supposed to be, the sales plan for the foreseeable future?
Well, not exactly. You see, the sales forecasts are never exactly right. This in turn means that your production orders won’t always be sold when you produce an item. Also, in turn, if your company is driving operational decisions – like batch sizing – with cost accounting, it’s likely you would pull forecasted figures from future months into today’s production run – to cut costs, right? Unfortunately, this leads to a number of negative effects. The first is that your operation is FILLED to the brim with inventory for all sorts of things – whether the items are actually selling in the marketplace. Further, because you’re producing to a forecast, two effects occur: 1) you under produce fast movers and 2) you over produce slow movers. This is because we do not know what products will sell quickly versus those that barely move; however, we’ve already made our production plans based on this flawed forecast. What then happens? Well the sales guys come screaming to the ops manager to produce more of the fast moving products, NOW! Unfortunately, your operation is already filled with inventory (WIP) because you needed optimize batch sizing and also ensure everyone had enough to work on at any one point. So, now the operations manager must stop EVERYTHING, reschedule, replan, and attempt to produce this URGENT order to get the sales team off his back. However, doing this means he must delay the current production orders to free up the needed capacity for the urgent order. Now the only way he can stick to his production schedule is to run overtime – again! It’s the same story, each and every month.
Now, what if your company only produces when there is a firm order – a REAL customer PO – behind every production order, much like a make-to-order job shop? There’s no forecasting these environments. It is true that there is no forecast, but job shops are guilty of another crime: “saving” setups.
Job shops are masters at pulling forward jobs in order to keep their workers on the floor busy – and this is reinforced by job costing systems! Job shops are unique in that they take to the extreme the facts that different work centers have different capacities as well as having employees with wildly different skill sets at vastly different levels of expertise (this is why shops spend so much time on job shop estimating and it’s difficult to determine custom machine shop prices). This means the shop manager must not only release enough work to keep the work centers busy, he must also release enough work to ensure there is enough mix of work to keep the differently skilled employees busy as well. Invariably, about the time you as the job shop manager have gotten everyone back to work – albeit on future orders – you get a RED-HOT order from your largest customer. Now you MUST drop EVERYTHING and get this order through, NOW! The effect is the same, because the operation has filled itself on inventory, there is no spare capacity to handle these changes in demand plus there’s oftentimes the logistical challenge of getting everything physically through the shop while all the other items/jobs wait for the rush order to complete (BTW – if this sounds like you, check out Dr. Lisa’s Velocity Scheduling System for custom job shops and machine shops).
It’s an all too common mode of operating caused by filling the operation with inventory. Also, filling the operation with inventory truly masks the capacity of the operation. This makes decision-making extremely tough. For instance, suppose one of these hot orders lands on your desk. Do you make it all in house or do you outsource aspects of it? Well, it may very well be that you are capable of producing the order in house but simply do not have the available capacity. What does this mean? It means you’re able to pay someone to do something that you probably should be doing yourself – for “free”. However, because your capacity is already committed, your safest choice is to outsource, pay your vendor, and deal with having lower profit margins. This is in addition to any overtime you’ll need to run to complete the order. All told your profit margins take a beating due to having high inventories. Surely, we can conclude from a profitability perspective this is not advantageous.
4. Value Add: Price – Investment
Low inventory companies do not need additional equipment, space or investment to support end-of-month syndrome.
Unfortunately, inventories do much more than just impact our profitability on the income statement. They also impact how much money we have to invest into our balance sheet as well. Operating with higher inventories certainly increases the amount of inventory as reported on the balance sheet (elaborate statement there, I know, but trust me, I’m a CPA) but it also increases other, seemingly unrelated line items on the balance sheet. Let’s examine the typical, high inventory operation and see if we can determine which accounts are increased and the linkage between high inventories and the need for more investment in the balance sheet.
The beginning of any month starts off nicely. We’re optimizing batch sizes as the cost accountants want us to do and we’re reaping the supposed “benefits” of having lowered “costs.” Nice. Unfortunately, we find about halfway through the month, if we don’t start breaking apart these batches we’ll NEVER meet the due dates our customers require. Also – and perhaps more importantly – we won’t meet our managers’ expectations for revenue for the month. This is certainly a list we don’t want to be on. So we begin to break batches, costs or no costs. However, allow me to share a story from my time as a controller to illustrate what happens next.
We produced armored military vehicles and operated according to the high inventory mantra that so many manufacturers believe in. Well, what would happen is exactly what I described. Around day 20 of any month, there would begin a mad dash to get the vehicles to the loading dock – completely finished. We’d break batches, get the product moving and start feeling alright. There was only once hiccup to this whole deal. The military did not want rusty steel vehicles, that simply wouldn’t do. They wanted nice, beautiful desert tan vehicles. Nothing else would do; apparently this was important to their missions it seemed. So we were obliged to paint the vehicles – from top to bottom – in that lovely shade of desert tan we’re all familiar with. Unfortunately, when you only have four painters trying to paint 20 vehicles in 3 days the math just doesn’t seem to work out. We had WAY too much demand, but much less capacity. So what did we do? Call in the temps! Can you paint? If so – PUT ON A SUIT AND PAINT! It was odd to me that an ordinary welder could become the next Michelangelo over the course of a 20 minute conversation. After noticing this a few months here’s what I discovered:
|
|
Painter Capacity | Demand |
| Week 1 (4 guys, 8hr shifts) | 160hrs | 20hrs |
| Week 2 (4 guys, 8hr shifts) | 160hrs | 20hrs |
| Week 3 (4 guys, 8hr shifts) | 160hrs | 60hrs |
| Week 4 (8 guys, 10hr shifts) | 400hrs | 380hrs |
| Totals | 880hrs | 480hrs |
Now if you did the math, you’d find out that we had approximately 500 hours of painting in a month and a capacity closer to 900 hours. Common sense would say you could cut this capacity, right? WRONG! If we didn’t have the painters we would have never finished anything in a month. You see, the first three weeks on the month, the painters spent more time on smoke breaks than they did painting. The reason was they had nothing to work on. No work, no problem. But the last week of the month they were SWAMPED! Now, beyond having to run overtime, incurring quality issues (remember that welder-painter combo…not exactly ideal), we also had to have additional painting capacity to cope with this massive run on our painting resources at the end of each month. This meant we had to have 3 paint booths to effectively get all the ordered vehicles produced and shipped. Fortunately, our paint booths were only about $70,000-$100,000 dollars a piece. An easy investment to justify simply because we wanted to run our operation with high inventories, right (hopefully you’re sensing the sarcasm here)?
The reality is that many companies’ operations are structured this way from a capacity standpoint. There can be massive investment in the operation at or near the end of production to cope with what is known as the end of month syndrome or the hockey stick phenomena. And, just like in the example I provided to you up above, oftentimes this capacity ISN’T NEEDED! Let’s say that again – WE DIDN’T HAVE TO SPEND THE MONEY! This is actually a terrible waste of our resources. You see, having this added capacity doesn’t actually allow us to generate more Throughput than we could had we operated with lower inventories, it’s simply driving up our investment and operating expenses with no increase in Throughput – a.k.a. a NEGATIVE INVESTMENT! Shocking I know, but unfortunately I see all too often folks investing in their companies and wondering why there hasn’t been an increase in profit. The reason is simple – their investments are not generating any returns, only more expenses. Some investment, eh?
Stay tuned for the other 2 value add inventory components …. (sign up for our newsletter and we’ll let you know when the next installment has posted)
Throughput Accounting FAQs
How do you calculate throughput in accounting?
In traditional accounting, throughput is a measurement of units completed by a process over a period of time e.g. units completed per hour. However in Theory of Constraints, Throughput is calculated as Sales minus Totally Variable Costs.
What is throughput in cost accounting?
In cost accounting and activity based costing, throughput is the number of units completed by a process for a defined period of time.
What is throughput in Theory of Constraints?
Throughput in the Theory of Constraints is the rate the system makes money (or goal units). It is a dollar amount. It is NOT units. Throughput is sales minus totally variable costs.
What is the theory of constraints in accounting?
The Theory of Constraints applied to accounting is called Throughput Accounting or TA for short.
What is bottleneck Throughput Accounting?
Bottleneck Throughput Accounting is the same as Theory of Constraints Throughput Accounting. I’m guessing someone just couldn’t remember Theory of Constraints but remembered it had something to do with managing bottlenecks!
What is throughput in management accounting?
Throughput in management accounting is typically considered as units completed per hour (or time period). Which is different from the Theory of Constraints view of throughput.
What is throughput rate?
In Theory of Constraints the rate that a system can generate throughput is limited by the constraint. So you can calculate the rate of throughput as the throughput generated divided by the constraint time. The result would be $/hr (or some time period).
How is throughput time calculated?
Throughput in Theory of Constraints is a dollar value, not time.
Are there Throughput Accounting CPE credit courses?
- Yes! We offer Throughput Accounting and other Theory of Constraints courses with NASBA CPE credits. Visit www.TheoryofConstraintsCPE.com
- We also offer an on-line coaching program to help custom manufacturers implement Throughput Accounting, including pricing and quoting. See www.VelocityPricingSystem.com
When to use Throughput Accounting?
Use Throughput Accounting to make day to day business decisions, investment decisions, go no-go decisions, to do what if analysis, to evaluate products, to evaluate customers, for pricing, to evaluate multi-site locations, make vs buy decisions, to decide if you want to accept a job, and for capacity analysis.
What is Throughput Accounting Ratios, Formulas, and Calculation?
There are a number of ratios, formulas and calculation used in Throughput Accounting. Here are a few:
- Productivity = T/OE (Throughput divided by Operation Expense)
- ∆T >∆OE (Change in Throughput greater than Change in Operating Expense). If ∆T >∆OE then your decision will result in additional profits.
- ROI = ∆T >∆OE/ ∆I
Why is Throughput Accounting Important?
Throughput Accounting is important for understanding your REAL numbers. Since cost allocations and other GAAP practices can distort your financial picture, it’s important to view your financials in an un-skewed way.
What is meant by Throughput Accounting?
Throughput Accounting is the Theory of Constraints method of accounting and financial management.
Throughput Accounting Definition
Throughput Accounting is the accounting and financial management method used in Theory of Constraints. In Throughput Accounting you do NOT allocate costs. The elimination of this allocation removes distortions found in other forms of accounting like Cost Accounting and Lean Accounting.
Throughput Accounting Advantages and Disadvantages
Throughput Accounting has a number of advantages:
- Ease of use – non-accounting and non-financial managers can easily use Throughput Accounting to evaluate profitability, determine the best product mix, to analyze investments, and to understand how/where/when/why the company is making money . This is a vital asset to strategic planning.
- Decision making is simpler and clear – because cost allocations are eliminated there are no distortions that can cloud the issue. How would you like to easily know if your making money or not?
- Fast implementation – Throughput Accounting can be used along side traditional GAAP accounting. The decision tools of Throughput Accounting can be used immediately with no changes to existing accounting practices. However, creating Throughput Accounting based profit and loss (P&L) statements and fully integrating Throughput Accounting can make the process of clearly identifying the right decisions for you, even faster. Either way, we have a course to teach you how to use Throughput Accounting in YOUR organization.
- Can co-exist with GAAP accounting – Creating the ability to use both or convert back and forth between Throughput Accounting and GAAP accounting can easily be accomplished and we can teach you how to do it!
Throughput Accounting has a number of disadvantages:
- Wide spread use – since Throughput Accounting is NOT widely used, it can create challenges with outside accountants who are not familiar with the power and ease of Throughput Accounting. For this reason, being able to easily convert between Throughput Accounting and GAAP accounting is essential (and as stated above can be easily accomplished).
- Education/Training – Traditional education and all CPE training for accountants and financial managers is based on GAAP accounting, at least until now! Our NASBA approval is pending. Once complete, you will find NASBA approved online Throughput Accounting CPE courses on this website.
- Awareness – Throughput Accounting is not widely known about. Dr Goldratt spoke to what is now the Institute of Management Accountants back in 1983. The title of his speech was Cost Accounting: The Number One Enemy of Productivity. The group largely agreed but asked what do we replace it with? Dr Goldratt then developed Throughput Accounting, but until GAAP changes there really is not an incentive for most accountant to learn Throughput Accounting.
Throughput Accounting vs Cost Accounting
Cost Accounting follows GAAP principles including cost allocations whereas, Throughput Accounting avoids all cost allocations to eliminate the distortions that can occur. What distortions?
Here’s just one example: In GAAP accounting practices, labor is part of cost of goods sold. To calculate contribution margin you take selling price minus cost of goods sold. That’s what the product has contributed. But to allocate direct labor to each product so you can calculate contribution margin, you have to estimate capacity and volume. A volume estimate means you are forecasting how much of each of your products you will sell so you can allocate direct labor to each sale. All of this sounds okay until you realize that in most cases, at least with the custom manufacturer’s we typically work with, the volume estimate will be off. And how can it be right, you’re forecasting (a nicer word for guessing) into the future how much of each product you are going to sell over the next year. This means that your direct labor allocation is WRONG. The capacity estimates are also typically wrong, but that’s an advanced topic!
Throughput Accounting Software
There is no software for Throughput Accounting. All Enterprise Resource Planning (ERP) software that companies use to run their businesses employ only GAAP accounting and financial management practices. But the good news is that you can easily create the ability to convert between Throughput Accounting and GAAP either within your existing ERP via custom reporting or in Excel. (And we can teach you how to do it!)
Throughput Accounting PDF and PPT
All our CPE courses include a PDF handout. But in addition to that you will find tons of free PDFs, PPTs, videos and articles on this site. Just go up to search bar an search on Throughput Accounting or any topic you’re interested in. Here’s a few popular ones (some are free some are paid):
- Jobs Lose Money? Theory of Constraints Throughput Accounting
- Throughput Accounting 101
- Throughput is Cumulative
- Definition of Cash Constraint
- Increasing Cash Velocity: The Theory of Constraints Approach to Cash Velocity
- The Fastest Way to Increase Cash Flow
- We also offer an on-line coaching program to help custom manufacturers implement Throughput Accounting, including pricing and quoting. See www.VelocityPricingSystem.com
Throughput Accounting Books and Articles
Below are a list of Throughput Accounting Books we recommend:
- The Haystack Syndrome by Goldratt
- The Measurement Nightmare by Smith
- The Theory of Constraints and Its Implications for Management Accounting by Noreen
- Throughput Accounting by Corbett
- Check out articles on Throughput Accounting, pricing and quoting on www.VelocityPricingSystem.com
Below are a list of Throughput Accounting articles:
- Throughput Accounting 101
- A Process of On-Going Improvement
- Cost Accounting: The Number One Enemy of Productivity

If you like this article, you may also like:
TOCICO Webinar: Back to Basics TOC – Throughput Accounting
Jobs Lose Money? Theory of Constraints Throughput Accounting
A Very Important Theory of Constraints Concept: Throughput is Cumulative (Max Profit #8)
Exit Planning for Manufacturers
Sales Commission — Effect on Throughput
Increase Throughput to Increase Cash Velocity
Achieving a Viable Vision aka Dr Lisa’s current Maximizing Profitability speech
Velocity Pricing System – A complete quoting and pricing system, along with strategic planning to help you add 10% to your Return on Sales


